
Understand How Your Landing Page Resonates With Buyers
Analyze competing brand landing pages using AI-generated personas and SSR (Semantic Similarity Rating). Get actionable insights into your brand's positioning in the market.
How It Works
Three simple steps to analyze your competitive landscape
Enter Your Product
Describe your product or service category using an Explicit Product Description (EPD). Choose B2B or B2C context.
Review Discovered Brands
AI extracts competing brands from Google's AI Overview. Review, remove, or mark your own brand before analysis.
Get Actionable Insights
Synthetic personas evaluate each brand's landing page, generating comparative ratings and categorized feedback.
Analyze Your Competitive Landscape
Enter your product description below to discover how your landing page compares to competitors.
Why “Explicit” matters: A specific EPD helps you qualify results. For example, “Enterprise CRM for Tax Professionals in the EU” yields a more tailored competitor set than “Enterprise CRM”, which can include many non-competitive results due to industry and location. You can still use a broader EPD, but a more explicit one typically gives better-quality competitor groups.
Starting analysis...
Core Features
Powered by advanced AI and semantic analysis
AI Overview Extraction
Automatically discover competing brands mentioned in Google's AI-generated search summaries for your product category.
Persona Landing Page Analysis
Generate realistic buyer personas with unique demographics, pain points, and goals that evaluate each brand's product/service landing page.
SSR Analysis
Semantic Similarity Rating extracts nuanced preference scores by comparing free-text responses to calibrated references.
Summary & Insights
Visualize brand positioning on a quadrant chart and receive feedback categorized by sentiment, based on persona evaluations.
Turn Persona Feedback Into Actionable Improvements
SSR analysis goes beyond simple ratings to uncover why your landing page resonates—or falls flat—with different buyer segments.
Identify Messaging Gaps
Discover which pain points your landing page addresses effectively and which ones leave potential customers unconvinced. Persona feedback reveals specific language and value propositions that resonate with your target audience.
Benchmark Against Competitors
See how your landing page stacks up against competitors in the same AI Overview. Understand why certain brands capture attention and trust while others get overlooked—then apply those insights to your own positioning.
Optimize for AI Visibility
AI-generated search results are reshaping how buyers discover products. The salience score shows how prominently your brand appears in AI Overviews, helping you understand and improve your visibility in this new search landscape.
Understand Implicit Sentiment
Traditional surveys capture what people say they think. SSR captures nuanced, implicit preferences by analyzing how persona responses semantically align with calibrated reference statements—revealing authentic reactions beyond surface-level feedback.
The combination of AI Visibility (how prominently you appear) and Persona Resonance (how well you convert attention into interest) provides a complete picture of your competitive position—and a clear roadmap for improvement.
The Science Behind SSR
This tool implements the Semantic Similarity Rating (SSR) methodology from the research paper "LLMs Reproduce Human Purchase Intent via Semantic Similarity Elicitation of Likert Ratings" View Research Paper .
How SSR Works
Unlike traditional surveys that ask LLMs to output a number directly, SSR extracts ratings by measuring semantic similarity between free-text responses and calibrated reference statements. This approach produces more human-like distributions and enables nuanced qualitative insights.
SSR (Semantic Similarity Rating)
A rating derived by comparing an LLM's free-text response to calibrated Likert reference statements using semantic embeddings. The response is compared via cosine similarity to each reference (1-5), then converted to a probability distribution via softmax. The expected value gives the SSR score.
FLR (Follow-up Likert Rating)
A traditional Likert rating (1-5) extracted from the LLM as a follow-up after it provides a free-text evaluation. While useful, FLR tends to produce less realistic distributions than SSR. Comparing FLR and SSR helps gauge rating consistency.
AI Visibility Salience Score
A composite score (1-5) measuring a brand's prominence in Google's AI Overview. It combines four dimensions: Position, Coverage, Sentiment, and Recommendation strength.
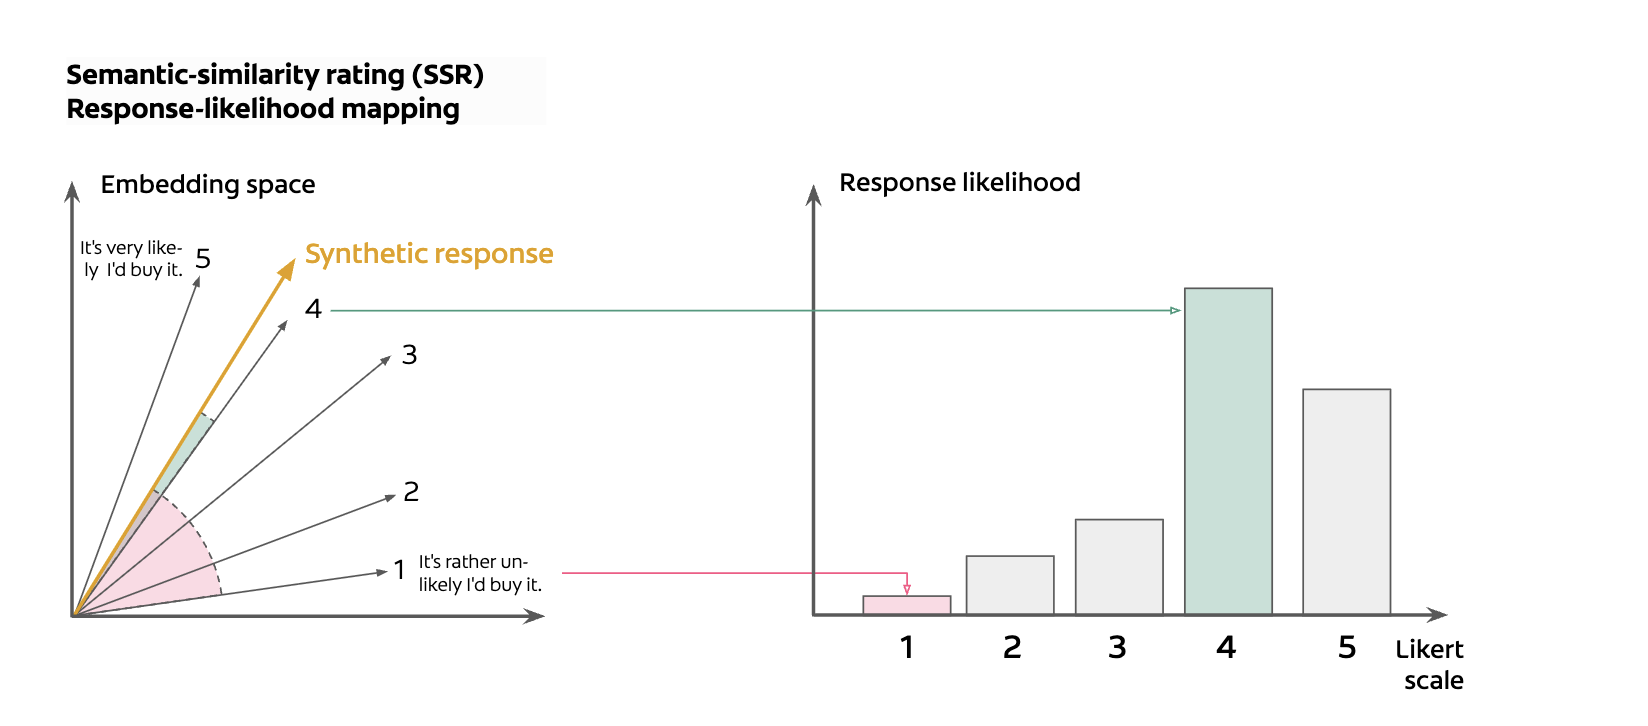
Semantic-similarity rating maps responses to a probability distribution across the Likert scale
"SSR achieves 90% of human test-retest reliability while maintaining realistic response distributions (KS similarity > 0.85)."
Example: How Responses Map to Ratings
Troubleshooting Tips
Getting the most out of your analysis
Not Finding the Right Brands?
Not Finding the Right Brands?
- Rephrase your EPD: Use industry-standard terminology or how customers would search
- Toggle B2B/B2C: Switching business type surfaces different brand sets
- Adjust specificity: "Project management software" vs "Construction project management software" yields different results
- Try synonyms: "CRM" vs "Customer relationship management" vs "Sales software"
Interpreting Unexpected Scores
Interpreting Unexpected Scores
- High variance: Wide confidence intervals indicate mixed persona reactions—check feedback summaries
- SSR < FLR: Implicit issues in content that personas articulated but didn't fully penalize numerically
- FLR < SSR: Personas were more critical in explicit ratings than written feedback suggested
- Low agreement: Large SSR/FLR gaps warrant deeper review of the feedback
Landing Page Content Limitations
Landing Page Content Limitations
- JavaScript-heavy sites: Dynamic content loaded after render may not be captured
- Visual elements: Images, videos, and design aesthetics aren't evaluated
- Interactive features: Demos, calculators, or chat widgets won't be reflected
- Gated content: Content behind forms or logins won't be accessible
- Navigation elements: Nav bars, menus, and footers are included in extracted content and may unexpectedly influence persona feedback
Landing Page Not Found?
Landing Page Not Found?
- Check status codes: 4xx or error status means the URL couldn't be reached
- Edit the URL: Click the landing page field to enter a specific product page
- Use product pages: Link directly to relevant product/service pages, not homepages
- Remove if needed: Consider removing brands without valid landing pages
Something Else Not Working?
Something Else Not Working?
- Email us at cloud [at] locomotive.agency for help with the tool or technical issues.
FAQs
What is an Explicit Product Description (EPD)?
An EPD is a clear, specific description of the product or service category you want to analyze. For example, "construction project management software" or "enterprise CRM platform". The more specific your EPD, the more relevant the competing brands and personas will be.
How are competing brands discovered?
The tool queries Google search and extracts brands mentioned in the AI Overview (the AI-generated summary at the top of search results). This ensures you're analyzing brands that Google's AI considers relevant to your product category.
What makes the personas realistic?
Personas are generated with realistic demographic constraints appropriate for B2B or B2C contexts. For B2B, this includes job titles, seniority levels, company sizes, and industry-specific pain points. Each persona has unique goals and challenges that influence how they evaluate landing pages.
How should I interpret the quadrant chart?
The quadrant chart plots brands on two axes: AI Visibility (salience score, x-axis) and Landing Page Effectiveness (SSR rating, y-axis). Brands in the upper-right quadrant have both high visibility and effective landing pages. The circles around each point represent the 95% confidence interval of the SSR rating.
Why might SSR and FLR ratings differ?
SSR measures the implicit sentiment in a persona's free-text response, while FLR is their explicit rating. Differences can occur when a persona's detailed feedback reveals concerns they didn't fully weight in their numerical rating, or when the explicit rating is influenced by factors not captured in the text response.
Can I add my own brand to the analysis?
Yes. After brands are discovered, you'll see a review screen where you can mark one brand as "My Brand" and optionally add or remove competitors. You can also manually add a landing page URL if your brand wasn't automatically discovered.
Like the tool? Get in touch.
Contact us